TiKV Development Guide
This guide is meant to help document how TiKV works, as well as to help new contributors get involved in TiKV development.
There are three parts to this guide:
Get Started
Build TiKV from Source
TiKV is mostly written in Rust, and has components written in C++ (RocksDB, gRPC). We are currently using the Rust nightly toolchain. To provide consistency, we use linters and automated formatting tools.
Prerequisites
To build TiKV you'll need to at least have the following installed:
git- Version control- [
rustup] - Rust installer and toolchain manager make- Build tool (run common workflows)cmake- Build tool (required for [gRPC])awk- Pattern scanning/processing language- C++ compiler -
gcc4.9+ (required for [gRPC])
If you are targeting platforms other than x86_64 linux, you'll also need:
llvmandclang- Used to generate bindings for different platforms and build native libraries (required for grpcio, rocksdb).
(Latest version of the above tools should work in most cases. When encountering any trouble of building TiKV, try upgrading to the latest. If it is not helped, do not hesitate to ask.)
Getting the repository
git clone https://github.com/tikv/tikv.git
cd tikv
# Future instructions assume you are in this directory
Building and testing
TiKV includes a Makefile that has common workflows and sets up a standard build environment. You can also use [cargo], as you do in many other Rust projects. To run cargo commands in the same environment as the Makefile to avoid re-compilations due to environment changes, you can prefix the command with scripts/env, for example: ./scripts/env cargo build.
Furthermore, when building by make, cargo is configured to use pipelined compilation to increase the parallelism of the build. To turn on pipelining while using cargo directly, set environment variable export CARGO_BUILD_PIPELINING=true.
To build TiKV:
make build
During interactive development, you may prefer using cargo check, which will parse, do borrow check, and lint your code, but not actually compile it:
./scripts/env cargo check --all
It is particularly handy alongside cargo-watch, which runs a command each time you change a file.
cargo install cargo-watch
cargo watch -s "./scripts/env cargo check --all"
When you're ready to test out your changes, use the dev task. It will format your codebase, build with clippy enabled, and run tests. In most case, this should be done without any failure before you create a Pull Request. Unfortunately, some tests will fail intermittently or can not pass on your platform. If you're unsure, just ask!
make dev
You can run the test suite alone, or just run a specific test:
# Run the full suite
make test
# Run a specific test
./scripts/test $TESTNAME -- --nocapture
TiKV follows the Rust community coding style. We use rustfmt and clippy to automatically format and lint our codes. Using these tools is included in our CI. They are also part of make dev, and you can run them alone:
# Run Rustfmt
make format
# Run Clippy (note that some lints are ignored, so `cargo clippy` will give many false positives)
make clippy
See the Rust Style Guide and the Rust API Guidelines for details on the conventions.
Please follow this style to make TiKV easy to review, maintain, and develop.
Build for Debugging
To reduce compilation time, TiKV builds do not include full debugging information by default — release and bench builds include no debuginfo; dev and test builds include line numbers only. The easiest way to enable debuginfo is to precede build commands with RUSTFLAGS=-Cdebuginfo=1 (for line numbers), or RUSTFLAGS=-Cdebuginfo=2 (for full debuginfo). For example,
RUSTFLAGS=-Cdebuginfo=2 make dev
RUSTFLAGS=-Cdebuginfo=2 ./scripts/env cargo build
Ask for help
If you encounter any problem during your journey, do not hesitate to reach out on the TiDB Internals forum.
[rustup]: https://rustup.rs/
[cargo]: https://doc.rust-lang.org/cargo/
[gRPC]: https://github.com/grpc/grpc
[rustfmt]: https://github.com/rust-lang/rustfmt
[clippy]: https://github.com/rust-lang/rust-clippy
Import TiKV into an IDE
Write and Run Unit Tests
Debug and Profile
In previous chapter, we introduce how to build TiKV from source, and in this chapter, we will focus on how to debug and profile TiKV from the view of a developer.
Prerequisites
- rust-gdb or rust-lldb
GDB and LLDB are commonly used for debugging a program.rust-gdbandrust-lldbare both installed withrustuptogether, however, they depend onGDBandLLDB, which are need to be installed by yourself. Here is the installation of GDB/LLDB.
Ubuntu: sudo apt-get install gdb/lldb CentOS: sudo yum install gdb/lldbGDBandLLDBcan also be used to debug rust program.- Basically,
rust-gdbis a wrapper that loads external Python pretty-printing scripts into GDB. This is useful (and somewhat necessary) when debugging more complex Rust programs because it significantly improves the display of Rust data types.rust-lldbis similar. Sorust-gdbandrust-lldbare recommended. - About how to choose between
rust-gdbandrust-lldb, it depends on the platform you are using and the familiarity of these tools. If you are new hand on the debugging tools,rust-lldbis recommended on MacOS andrust-gdbis recommended on Linux, like Ubuntu and CentOS.
- perf
Perf is common Linux profiler. It's powerful: it can instrument CPU performance counters, tracepoints, kprobes, and uprobes (dynamic tracing). It can be installed as following:
Ubuntu: sudo apt-get install linux-tools
CentOS: sudo yum install perf
For simplicity, we will introduce the debugging with rust-gdb, audience can also use rust-lldb.
Debug TiKV with rust-gdb
Debug a unit test binary in TiKV
- Build the unit test binary, for example we want to debug the test case: test_raw_get_key_ttl
Firstly, we can get the binary file with cargo command, like:
cargo test -p tikv test_raw_get_key_ttl
A binary file located in target/debug/deps/tikv-some-hash will be produced.
- Debug the binary with rust-gdb:
rust-gdb --args target/debug/deps/tikv-4a32c89a00a366cb test_raw_get_key_ttl
- Now the standard gdb interface is shown. We can debug the unit test with gdb command. Here are some simple commands.
- r(run) to start the program.
- b(break) file_name:line_number to set a breakpoint.
- p(print) args to print args.
- ls to show the surrounding codes of breakpoint.
- s(step) to step in the function.
- n(next) to step over current line.
- c(continue) to continue the program.
- watch to set a data watch breakpoint.
An example of debugging an unit test named test_raw_batch_get is as following:
- Build
tikvunit test binary withcargo test -p tikv test_raw_batch_getand binary is located intarget/debug/deps/tikv-<somehash> - Launch the binary with
rust-gdb
rust-gdb --args target/debug/deps/tikv-<somehash> test_raw_batch_get
- debug
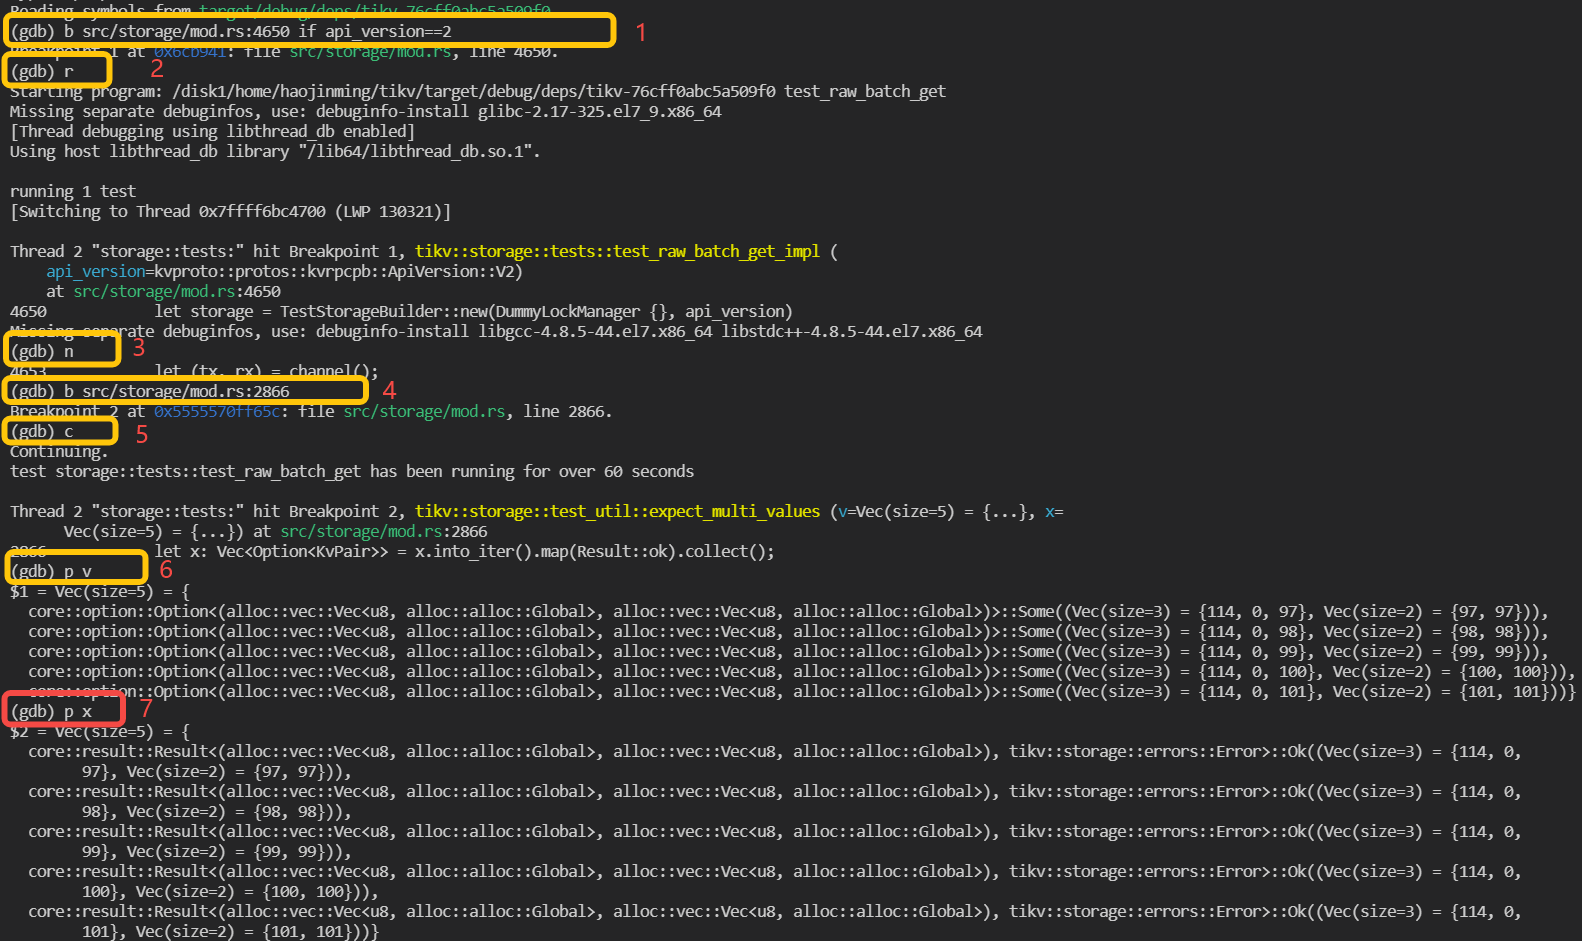
As the marks shown in above screenshot, firstly, a breakpoint is set in line 4650 of file src/storage/mod.rs and set condition that api_version == 2, which means program only pause when it hit here and the variable api_version is equals to 2. Then run is executed and the program start to run. The following steps are some examples to use gdb commands to execute the step over and print.
Debug TiKV cluster with specified tikv-server binary
- Build tikv-server binary with the guide in previous chapter.
- The binary files are located in
\${TIKV_SOURCE_CODE}/target/debug/tikv-server. Debug binary is recommended as it keep much useful debug info, such as codes, lines, local variables. - TiUP is recommended to deploy a TiKV cluster. It's easy to deploy a local TiKV cluster with tiup playground. Please refer to Get start in 5 minutes. With TiUP, we can also specify the tikv-server binary file during deploy. The following is an example:
TIKV_BIN=~/tikv/target/release/tikv-server

tiup playground v5.0.4 --mode tikv-slim
  --kv 3 --kv.binpath ${TIKV_BIN} --kv.config ./tikv_rawkv.toml
- Now we get one TiKV cluster with three TiKV virtual nodes and one PD node. we can use
rust-gdbto attach thetikv-serverprocess.
rust-gdb attach `pid of tikv-server`
pid of tikv-server can be obtained with the following command:
ps -aux|grep tikv-server
Now the standard GDB interface is shown. The following steps are just the same as debugging unit test binary.
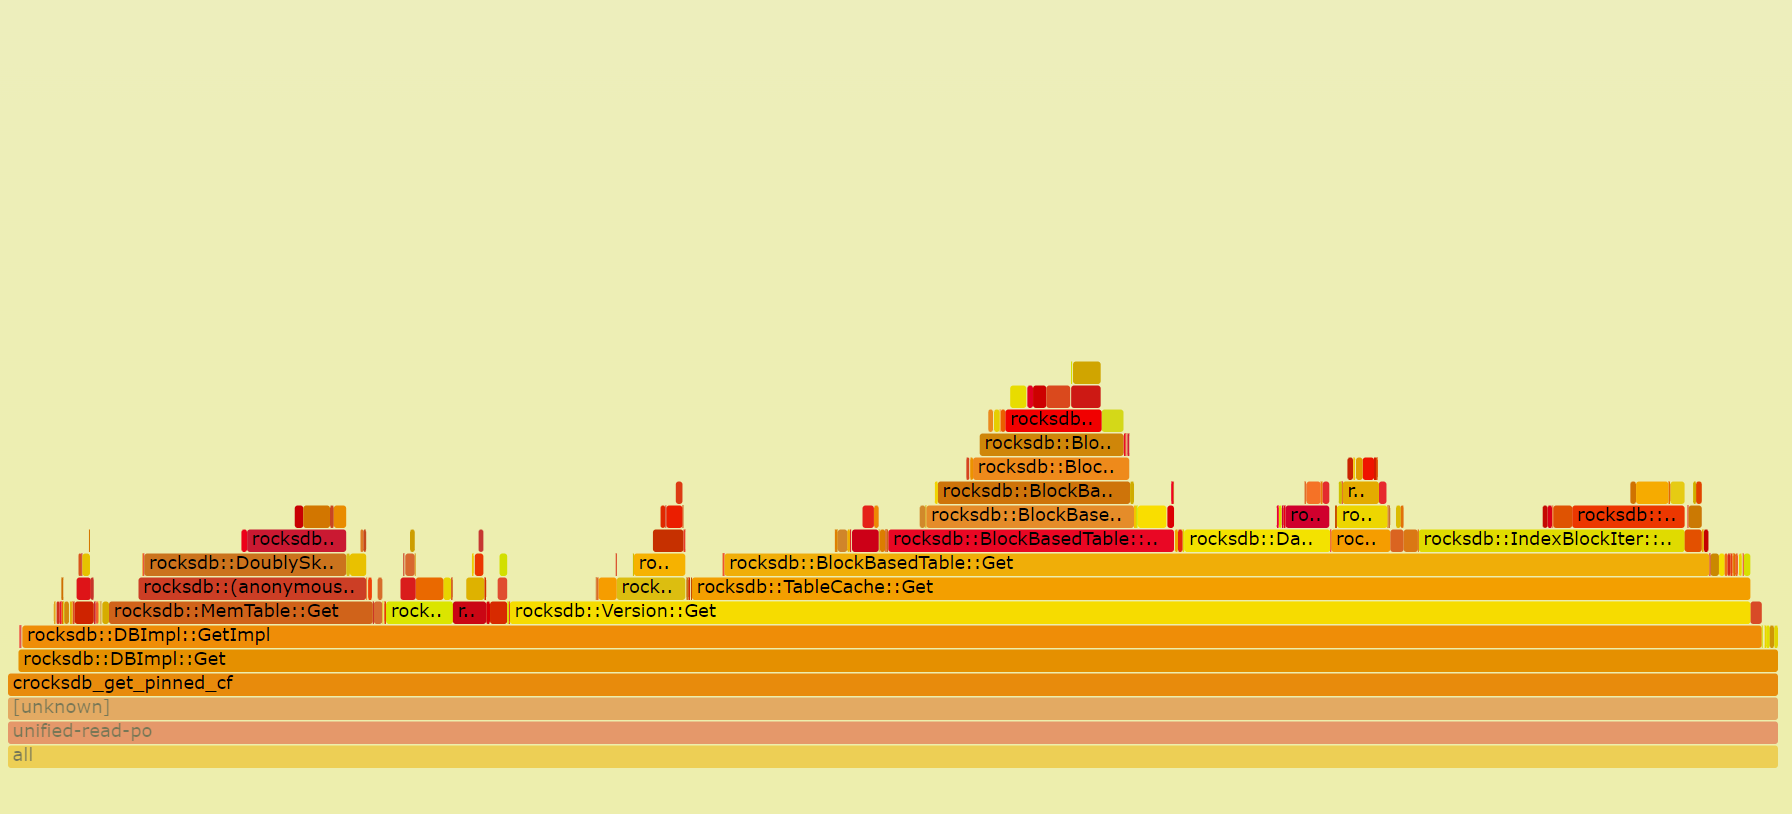
Profiling TiKV
When we want to find the CPU bottleneck of one program, we can use perf Linux profiler to find the procedures and how much CPU time they are consuming. It can also be used for profiling TiKV. FlameGraph can also be used to visualize stack traces with interactive SVGs. FlameGraph can be downloaded from here:
git clone https://github.com/brendangregg/FlameGraph.git
Here is one example:
- Recording performance data with
perf
perf record -g -p `pidof tikv-server`
- Generate text report
perf report
- Parse the perf data with script.
perf script -i perf.data &> perf.unfold
- Generate the flame graph
./stackcollapse-perf.pl perf.unfold &> perf.folded

./flamegraph.pl perf.folded > perf.svg
- We can open the
svgfile withChromeor other browsers. With the flame graph, we can see the performance data more intuitively.
Submit a Pull Request
Contribute to TiKV
Community Guideline
Committer Guide
Report a Bug
Contribute code
Review a Pull Request
Request for Comments
Code Style and Quality Guide
Write document
Understanding TiKV
TiKV is a distributed, transactional key-value database. It is fully ACID compliant and features automatic horizontal scalability, global data consistency, geo-replication, and many other features. It can be used as a building block for other high-level services.
In this chapter, we will introduce everything about the design and implementation of TiKV. We hope that through this chapter, you can develop a deep understanding of TiKV, and build your knowledge of distributed programming.
History
In the middle of 2015, we decided to build a database which solved MySQL's scaling problems. At that time, the most common way to increase MySQL's scalability was to build a proxy on top of MySQL that distributes the load more efficiently, but we don't think that is the best way.
As far as we knew, proxy-based solutions have following problems:
- Building a proxy on top of the MySQL servers cannot guarantee ACID compliance. Notably, the cross-node transactions are not supported natively.
- It poses great challenges for business flexibility because the users have to worry about the data distribution and design their sharding keys carefully to avoid inefficient queries.
- The high availability and data consistency of MySQL cannot be guaranteed easily based on the traditional Source-Replica replication.
Although building a proxy based on MySQL directly might be easy at the beginning, we still decided to chose another way, a more difficult path — to build a distributed, MySQL compatible database from scratch.
Fortunately, Google met the same problem and had already published some papers to describe how they built Spanner and F1 to solve it. Spanner is a globally distributed, externally consistent database and F1 is a distributed SQL database based on Spanner. Inspired by Spanner and F1, we knew we could do the same thing. So we started to build TiDB - a stateless MySQL layer like F1. After we released TiDB, we knew we needed an underlying Spanner-like database so we began to develop TiKV.
Architecture
The diagram below shows the architecture of TiKV:
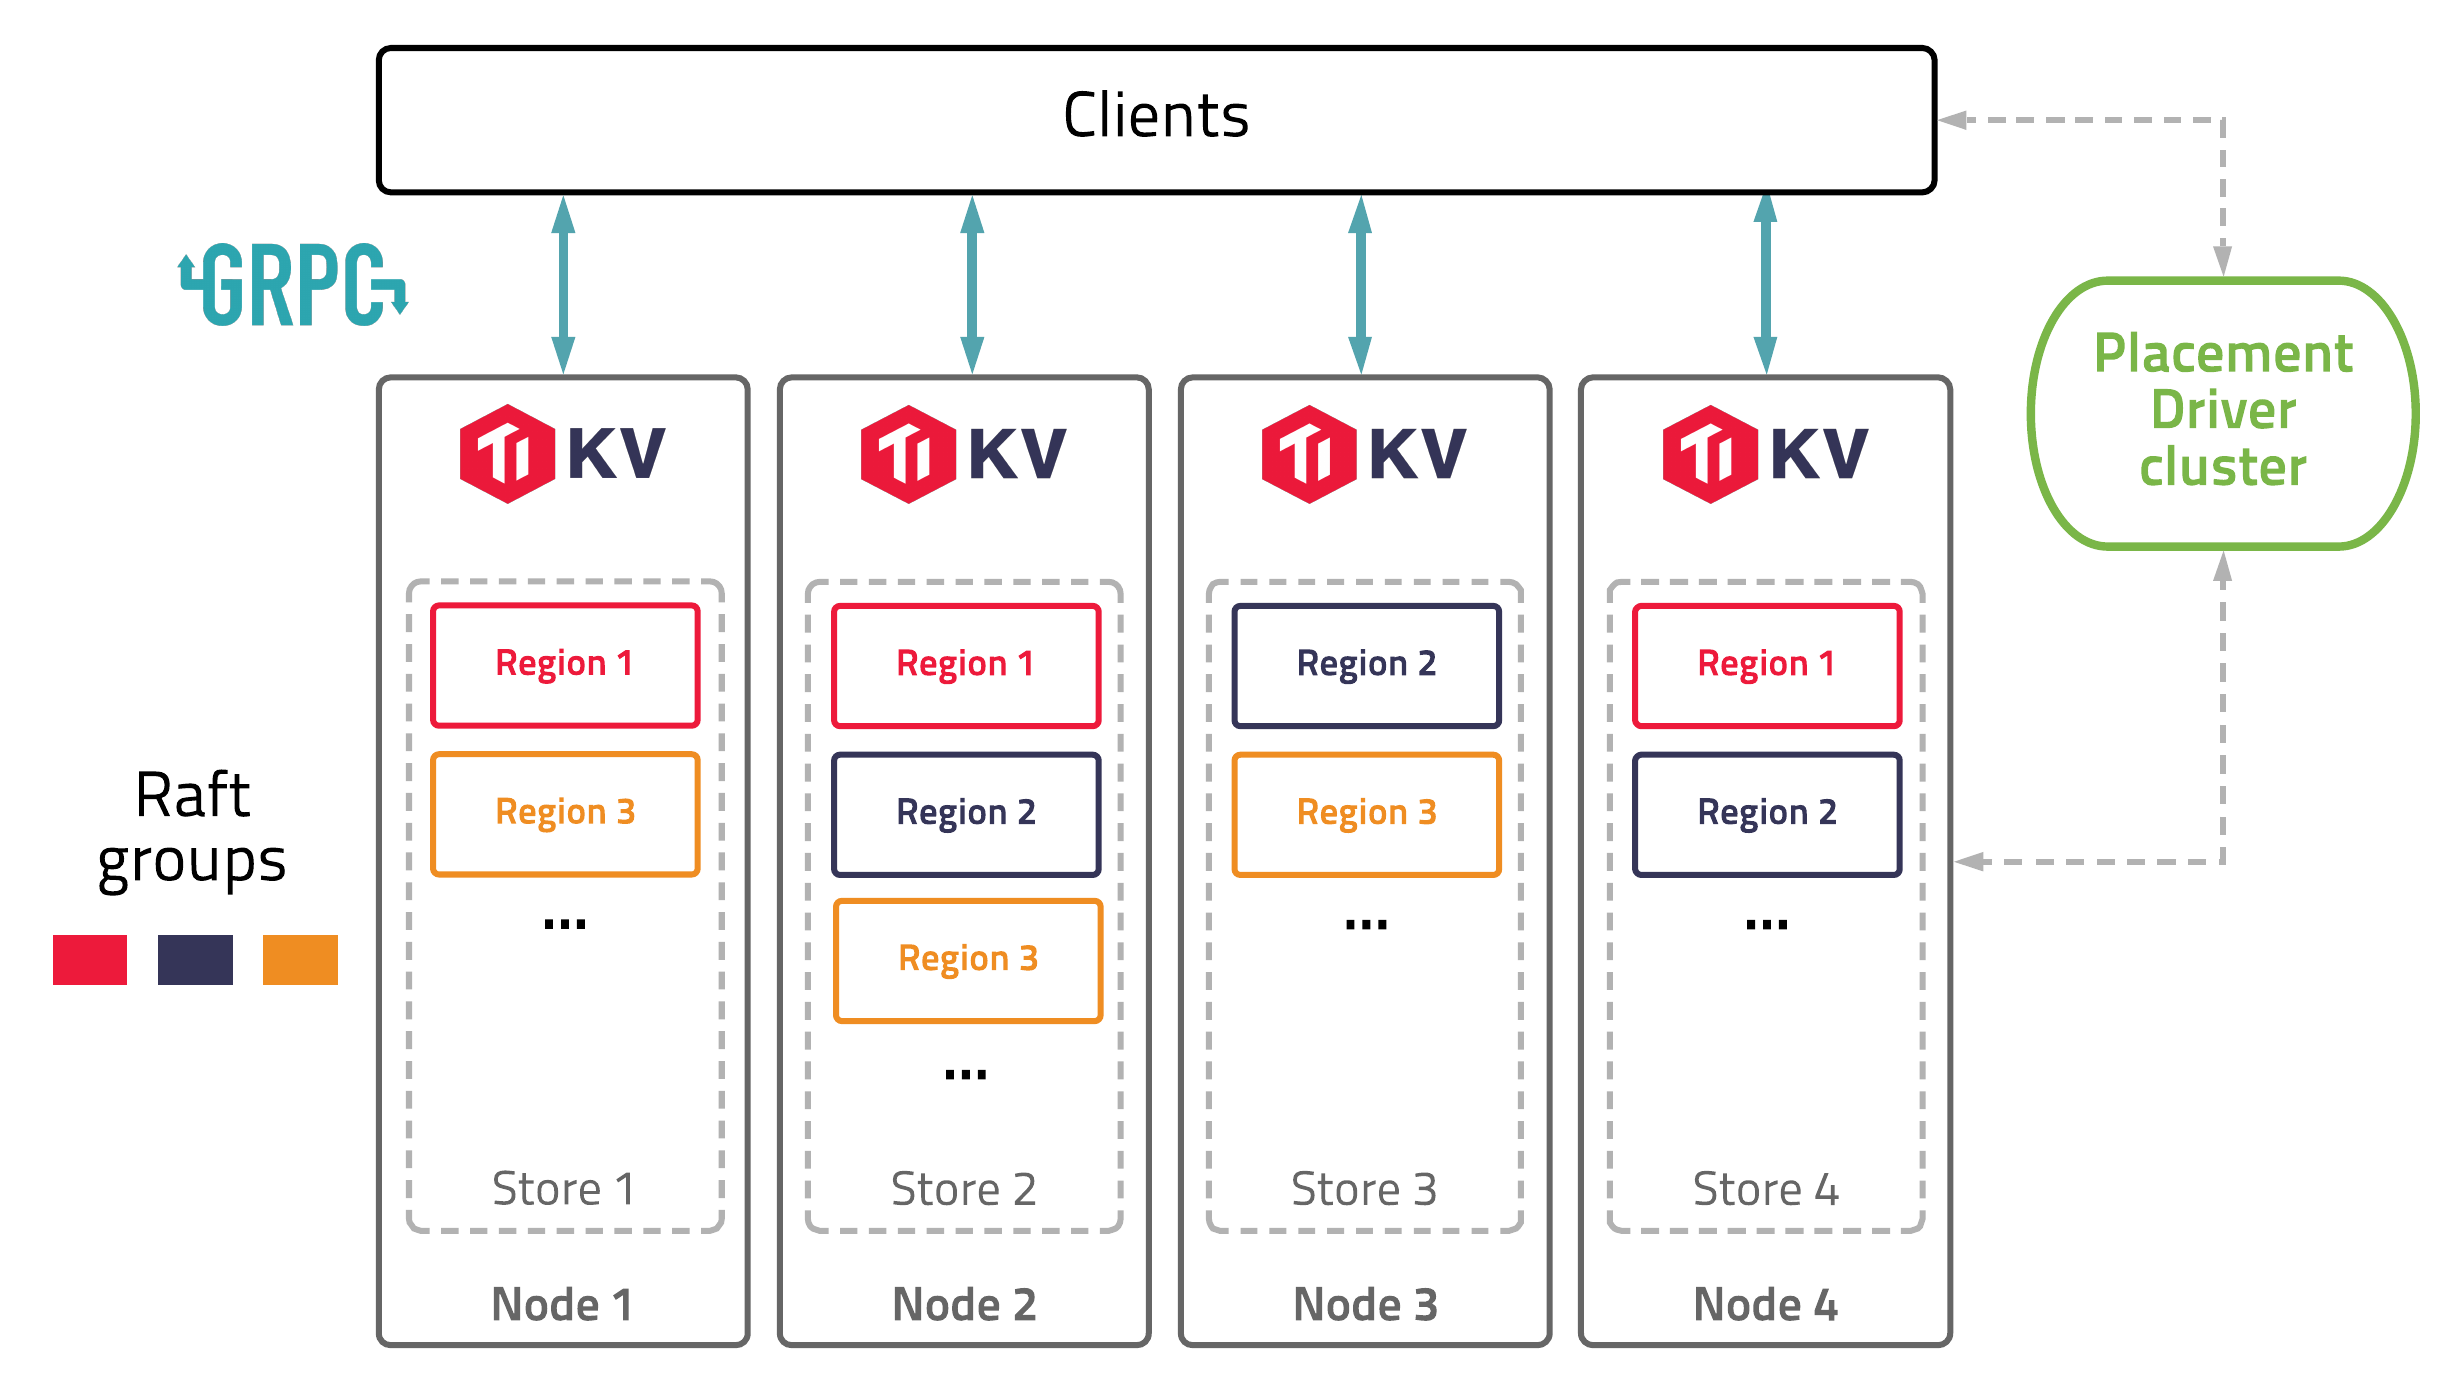
In this illustration, there are four TiKV instances in the cluster and each instance uses one key-value engine to save data. On top of key-value engine, TiKV uses the Raft consensus algorithm to replicate the data. In practice, we use at least three replicas to keep data safe and consistent, and these replicas form a Raft group.
We use the traditional multiversion concurrency control (MVCC) mechanism and have built a distributed transaction layer above the Raft layer. We also provide a Coprocessor framework so that users can push down their computing logic to the storage layer.
All the network communications are through gRPC so that contributors can develop their own clients easily.
The whole cluster is managed and scheduled by a central service: the Placement Driver (PD).
As you can see, the hierarchy of TiKV is clear and easy to understand, and we will give more detailed explanation later.
Overview
Talk about the architecture
Raw KV
How raw get and raw put are processed
Transaction KV
How 2PC works, how prewrite and commit are processed. (only focus on the optimistic transaction)
Scalability
In the database field, Scalability is the term we use to describe the capability of a system to handle a growing amount of storage or computation. Even if a system is working reliably and fast on a small scale today, it doesn't mean it will necessarily work well in the future, especially when the increased load exceeds what the system can process. In modern systems, the amount of data we have to process can far outgrow our original expectations, so scalability is a critical consideration for the design of a database.
There are two main types of scalability:
-
Vertical scaling, which is also known as scaling up, means adding resources to a single node in a system, typically involving the improvement of CPU, memory, or storage, to become a more powerful single computer. Vertical scaling is limited by the technology of the semiconductor industry, and the cost per hertz of CPU or byte of memory/storage will increase dramatically when near the technical limit.
-
Horizontal scaling, which is also known as scaling out, means adding more machines to a system and distributing the load across multiple smaller machines. As computer prices have dropped and performance continues to increase, high-performance computing applications have adopted low-cost commodity systems for tasks. System architects may deploy hundreds of small computers in a cluster, to obtain aggregate computing power that is far more powerful than a system based on a stand-alone single computer. Moreover, with the widespread use of Cloud computing technology, horizontal scalable is necessary for a system to adapt to the resiliency of Cloud.
A system whose performance improves after adding hardware, proportionally to the added quantity, is said to be a scalable system. It's obvious that a scalable system depends on the ability of horizontal scaling.
TiKV is a highly scalable key-value store, especially comparing with other stand-alone key-value stores like RocksDB and LevelDB.
To be scalable, TiKV needs to solve the following problems:
-
Partitioning: how to break data up into partitions, also known as sharding, to fully utilize resources of nodes in cluster. In TiKV, a partition is called a
Region. -
Scheduling: how to distribute the Regions in cluster, for balancing the load among all nodes, and eliminating hot spots or other bottle necks.
In the rest of this chapter, we will talk about Region and Scheduling of TiKV.
Region
Sharding is one of the most necessary characteristic for a storage system to be scalable (or more specifically, horizontally scalable). By breaking data up into partitions, a storage system can distribute data across computers in the cluster, to fully utilize resource of every single node. Meanwhile, migrate partitions to re-balance computing and storage loads when adding nodes to cluster, to gain performance improvement proportional to the increasing of number of nodes, i.e, to archive Scalability.
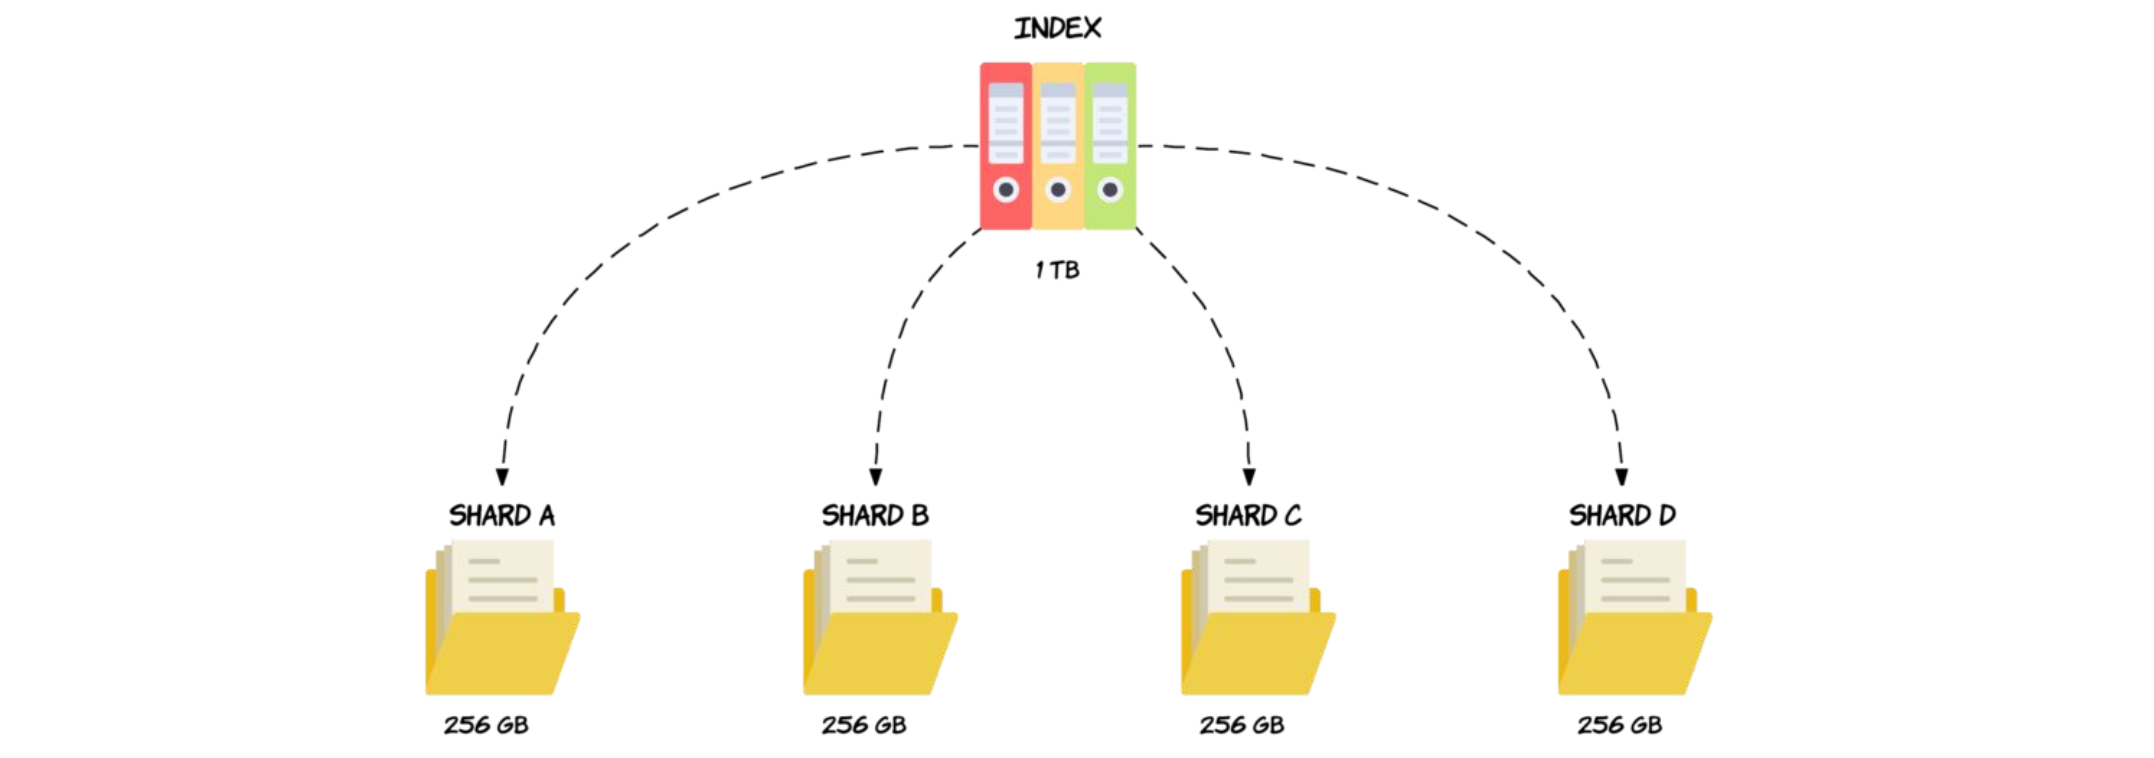 Diagram 1, Data Sharding [1]
In TiKV, partition is named as Region, which is the data unit to be distributed and migrated among TiKV nodes. Region is also the data unit to be replicated by Raft, to archive High-Availability. A region is likewise a Raft Group in Raft algorithm, composed of one or more Peers, while a peer is one of the replica of a partition.
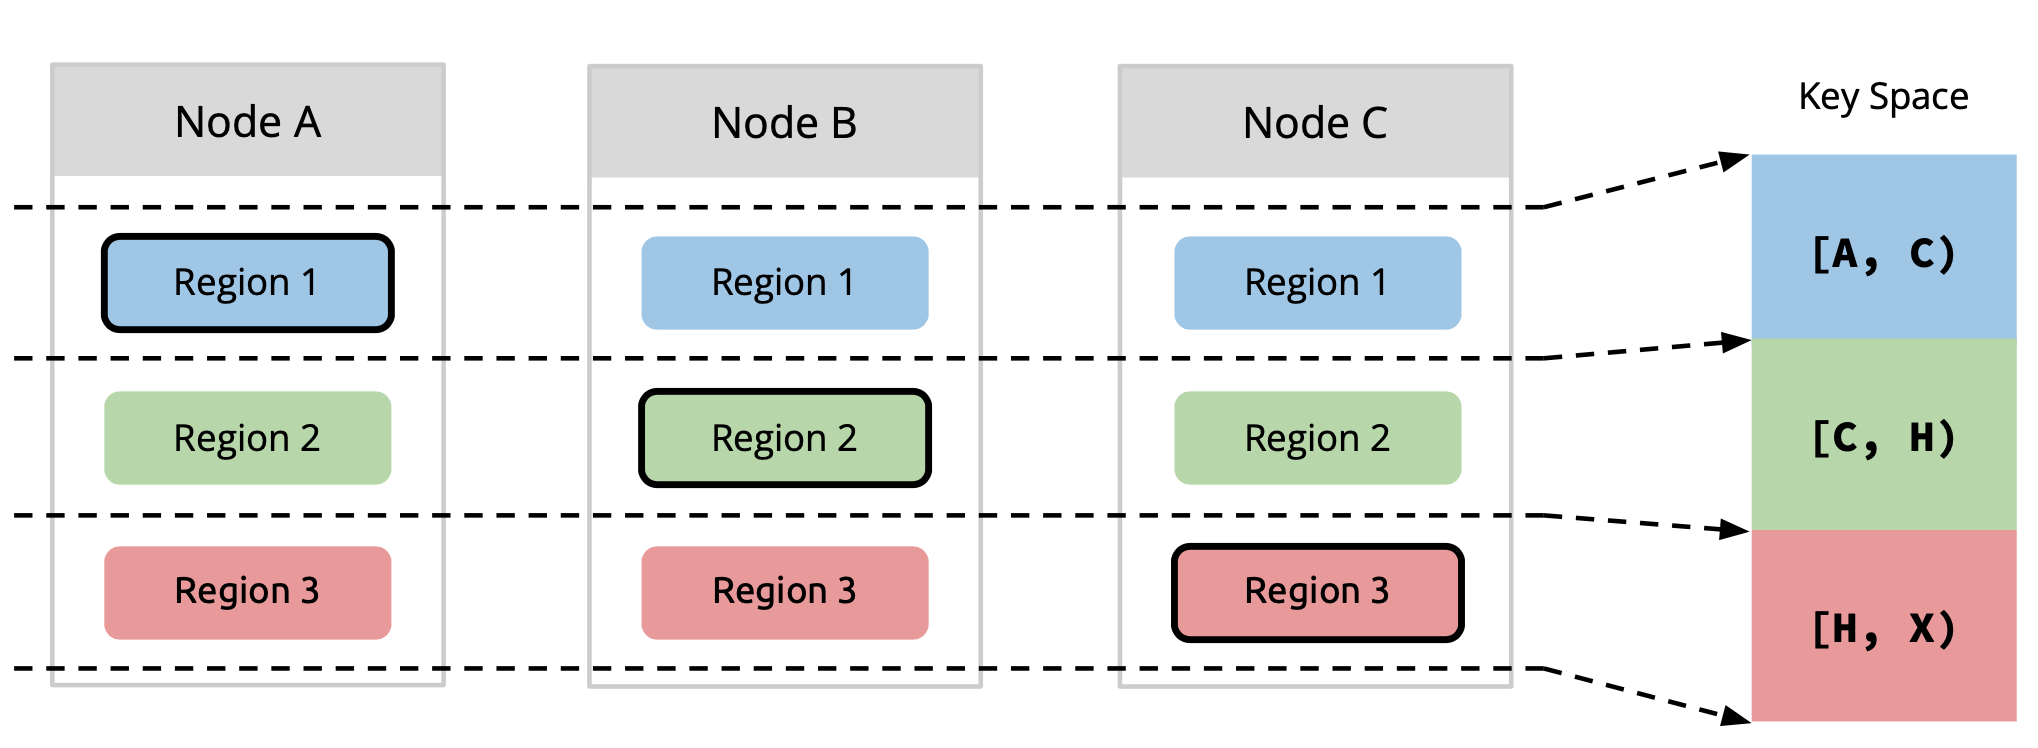 Diagram 2, Region & Replication [1]
How does TiKV split data into regions? As data element of TiKV is key-value pair, we first decide which keys should be put into a region. In general, there are two approaches:
-
Sharding by hash: splitting by hash of keys (e.g. consistent hashing). It is easier to be implemented, as location of keys can be calculated by clients. But it is more difficult to scale up, consistent hashing makes things more complicated, and not efficient to range queries.
-
Sharding by range: splitting by range of keys. It is simple, good for scan, easy to scale by splitting and merging, even can switch to sharding by hash easily. But it needs additional management of metadata of partition.
TiKV splits data by key range. Each region contains a continuous range of keys. The Placement Driver (PD) server stores the [start_key, end_key) and other metadata of each region, and performs the scheduling of regions.
Then, we determine how many key-value pairs should be stored in one region. The size of a region should not be too small, otherwise the management cost of too many regions would be high. Meanwhile, the size should not be too large, or else region migration would be expensive and time-consuming.
By default, each region is expected to be about 96MB (see region-split-size) in size. Large regions more than 144MB (see region-max-size) will be split into two or more regions with 96MB each. Small adjacent regions less than 20MB (see max-merge-region-size) will be merged to one.
Moreover, each region is expected to contain more or less 960000 (see region-split-keys) keys, because region size calculation will need to scan all keys in the region. Big regions with more than 1440000 (see region-max-keys) keys will be split, while regions with more than 200000 (see max-merge-region-keys) keys will NOT be merged.
Reference
[1] Wenxuan, PingCAP, "DEEP DIVE TIKV"
Scheduling
This section introduces the scheduling mechanism.
The scheduling mechanism is mainly by summarizing the collected cluster real-time status information (including the heartbeat of the region and the heartbeat of the store), and then judging whether scheduling needs to be generated according to different strategies, and then generate scheduling Operator which is send to TiKV to do scheduling. the Operatorstruct like:
    // Operator contains execution steps generated by scheduler.
    type Operator struct {
        desc             string
        brief            string
        regionID         uint64
        regionEpoch      *metapb.RegionEpoch
        kind             OpKind
        steps            []OpStep
        stepsTime        []int64 // step finish time
        currentStep      int32
        status           OpStatusTracker
        level            core.PriorityLevel
    }
Each scheduling Operator is only used to operate a region migration, which including some OpSteps: add peer, transfer the raft group leader and remove peer. an Operator will record the ID of the operator region, the relative strategy name, operator priority level etc. The Operator in PD may be generated from two operate, one is the checker and the other is the scheduler. The generated schedule will be stored in a map, and then it will be returned to the corresponding TiKV through the response when the region heartbeat comes. Let us first look at how checker and scheduler work.
Checker
After PD server started, there is a background worker will polling all regions and then check the health status of each region:
    func (c *coordinator) patrolRegions() {
        timer := time.NewTimer(c.cluster.GetPatrolRegionInterval())
        for {
            select {
            case <-timer.C:
                timer.Reset(c.cluster.GetPatrolRegionInterval())
            case <-c.ctx.Done():
                log.Info("patrol regions has been stopped")
                return
            }

            regions := c.cluster.ScanRegions(key, nil, patrolScanRegionLimit)
            for _, region := range regions {
                if c.checkRegion(region) {
                    break
                }
            }
        }
    }
In this function, checkRegion will be executed to determine whether the region needs to be scheduled. If a schedule Operator is generated, it will be sent to TiKV through the heartbeat of this region. The initialization of the checker can be found in coordinator.go, which mainly contains four checkers: RuleChecker, MergeChecker, JointStateChecker and SplitChecker.
RuleChecker is the most critical checker. It will check whether a region has down peers or offline peers. It will also check whether the number of replicas of the current region is the same as the number of replicas specified in the Placement Rules. If the conditions are met, it will trigger the logic of the corresponding supplementary replicas or delete the redundant replicas. In addition, RuleChecker will also check whether the current copy of this region is placed in the most reasonable place, and if not, it will be placed in a more reasonable place.
MergeChecker will check whether the current region meets the merge conditions, such as whether the size of the region is less than max-merge-region-size, whether the key of the region is less than max-merge-region-keys, and whether there has been no split operation in the recent period, etc. If these conditions are met, an adjacent region will be selected to try to merge the two regions.
Scheduler
Let's first take a look at the code about the scheduler running process. Schedulers are running concurrently. Each scheduler has a scheduler controller, which running in a background worker:
func (c *coordinator) runScheduler(s *scheduleController) {
    defer logutil.LogPanic()
    defer c.wg.Done()
    defer s.Cleanup(c.cluster)

    timer := time.NewTimer(s.GetInterval())
    defer timer.Stop()

    for {
        select {
        case <-timer.C:
            timer.Reset(s.GetInterval())
            if !s.AllowSchedule() {
                continue
            }
            if op := s.Schedule(); len(op) > 0 {
                added := c.opController.AddWaitingOperator(op...)
                log.Debug("add operator", zap.Int("added", added), zap.Int("total", len(op)), zap.String("scheduler", s.GetName()))
            }

        case <-s.Ctx().Done():
            log.Info("scheduler has been stopped",
                zap.String("scheduler-name", s.GetName()),
                errs.ZapError(s.Ctx().Err()))
            return
        }
    }
}
Similar to the checker, when the PD starts, the specified scheduler will be added according to the configuration. Each scheduler runs in a goroutine by executing go runScheduler, and then executes the Schedule() function at a dynamically adjusted time interval.
There are two things that a function has to do. The first is to execute the scheduling logic of the corresponding scheduler to determine whether to generate an Operator, and the other is to determine the time interval for the next execution of Schedule().
PD contains many schedulers. For details, you can check the server/schedulers package, which contains the implementation of all schedulers. The schedulers that PD will run by default include balance-region-scheduler, balance-leader-scheduler, and balance-hot-region-scheduler. Let's take a look at the specific functions of these schedulers:
- The
balance-region-schedulercalculates a score based on the size of the region size on a store and the usage of available space. Then, according to the calculated score, the region is evenly distributed to each store through theOperatorthat generates the balance-region. The reason why the available space is considered here is that the actual situation may have differences in storage capacity of different stores. - The
balance-leader-scheduleris similar to the balance-region-scheduler. It calculates a score based on the region count, and then uses theOperatorthat generates the balance-leader to distribute the leaders as evenly as possible across the stores. - The
balance-hot-region-schedulerimplements the related logic of hot spot scheduling. For TiDB, if there are hot spots and only a few stores have hot spots, then the overall resource utilization of the system will be lowered, and it is easy to form a system bottleneck. Therefore, PD also needs to count the hot spots in response to this situation. Come out, and by generating the corresponding schedule, the hot spots are scattered to all stores as much as possible. So that all stores can share the pressure of reading and writing.
There are some other schedulers to choose from. Each scheduler of PD implements an interface called Scheduler:
// Scheduler is an interface to schedule resources.
type Scheduler interface {
    http.Handler
    GetName() string
    // GetType should in accordance with the name passing to schedule.RegisterScheduler()
    GetType() string
    EncodeConfig() ([]byte, error)
    GetMinInterval() time.Duration
    GetNextInterval(interval time.Duration) time.Duration
    Prepare(cluster opt.Cluster) error
    Cleanup(cluster opt.Cluster)
    Schedule(cluster opt.Cluster) []*operator.Operator
    IsScheduleAllowed(cluster opt.Cluster) bool
}
The most important thing is the Schedule() interface function, which is used to implement the specific scheduling-related logic of each scheduler.
In addition, the interface function IsScheduleAllowed() is used to determine whether the scheduler is allowed to execute the corresponding scheduling logic. Before executing the scheduling logic, each scheduler will firstly call this function to determine whether the scheduling rate is exceeded. Specifically, in the code, this function is called AllowSchedule(), and then the IsScheduleAllowed() method implemented by different schedulers is called.
PD can control the speed at which the scheduler generates operators by setting the limit, but the limit here is just one that maintains a window size, and different operator types have their own window sizes. For example, balance-region schedulers and balance-hot-region schedulers will generate operators related to migrate region, and the type of this operator is OpRegion. We can control the operator of this type of OpRegion by adjusting the region-schedule-limit parameter. The specific operator type definition can be found in the file operator.go. An operator may contain multiple types. For example, the operator generated by balance-hot-region may belong to both OpRegion and OpHotRegion.
More
This section mainly introduces the main operation process of PD scheduling. For more details, you can continue to refer to the corresponding code study. And, welcome to contribute good first issues.
See more information about PD implementation on its Wiki page.
High Availability
Raft
what is Raft, how it works
raft-rs
Leader Lease
Hibernate Region
Multi-Raft
Split
region epoch, conf version
Merge
PrepareMerge, CommitMerge, RollbakMerge
RaftStore
Actor Model
FSM
Transaction
Percolator
TSO
how pd tso works, how global/local tso works
Encode
mvcc encode, memcomparable encode, key adjustment on region split
Command
Latch and Scheduler
Pessimistic Transaction
pessimistic lock, deadlock detecter
Async Commit
1PC
Stale Read
CDC
Storage
RocksDB
Encode
Import and Export
IO Rate Limiter
TiKV Coprocessor
Why Coprocessor?
TiKV is a distributed key-value storage engine made for TiDB. When TiDB executes a query, basically, it will need to retrieve and scan full rows from TiKV. Consider the following query:
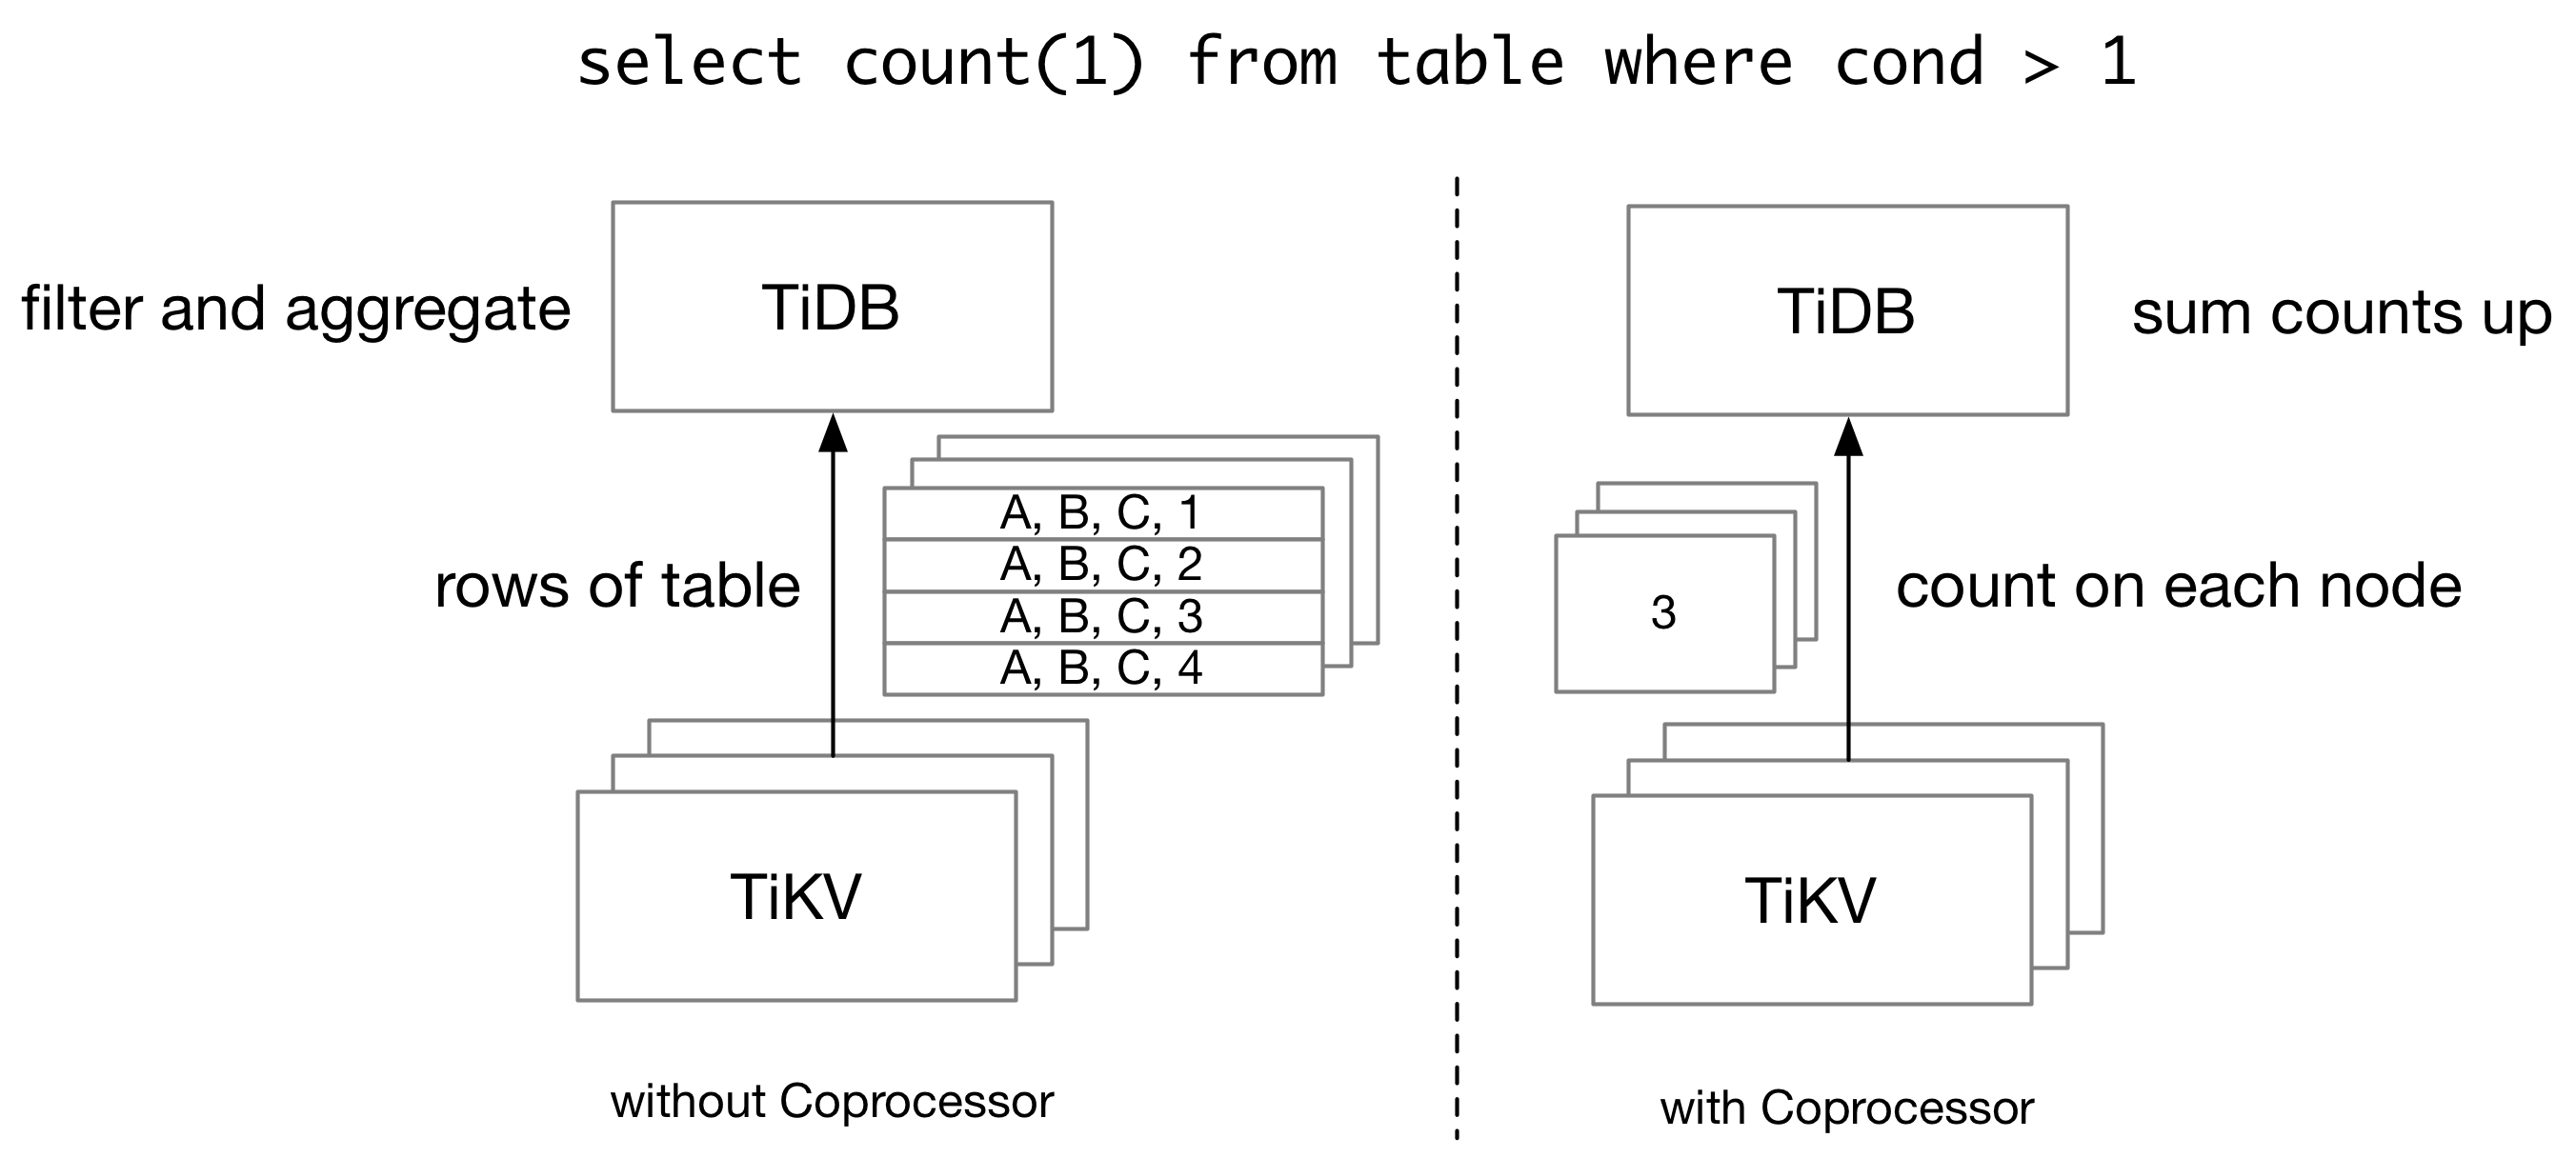
Without TiKV coprocessor, TiDB needs to retrieve all rows from TiKV, and then scan and filter them on the TiDB side, even if we only have a single number as the query result. In order to reduce the network traffic for a query, TiDB pushes some computations down to TiKV Coprocessor, which runs queries on the TiKV side.
A TiKV cluster is composed of multiple TiKV nodes, and thus TiKV coprocessor cannot run all queries which TiDB supports. On one side, TiKV itself only holds part of the data which a query needs. Therefore, for an aggregation query, each TiKV node can only calculate partial sums, and TiDB needs to aggregate the partial sums into the final sum. On the other side, TiKV Coprocessor only supports a limited number of executors. Complex operations like join cannot be done on TiKV.
In this article, we will introduce the basics of TiKV Coprocessor from a developer's perspective.
Overview of TiKV Coprocessor
The TiKV Coprocessor is able to handle multiple kinds of requests. Previously, we mentioned "push-down execution". This is handled by DAG handler in the TiKV Coprocessor. The Coprocessor also supports Checksum and Analyze requests. At the same time, the TiKV Coprocessor is not limited to TiDB queries. In Coprocessor v2, developers can dynamically load Coprocessor plugins into a TiKV node, which could process any execution requests that need access to key-value data stored on the TiKV side.
The code for the TiKV Coprocessor is stored in src/coprocessor directory. And folders begin with tidb_query_ in components is used by TiKV Coprocessor to run TiDB queries.
Here we focus on DAG handler in the TiKV Coprocessor. Running queries on the TiKV side requires two things: a plan to run query, and the data needed by a query.
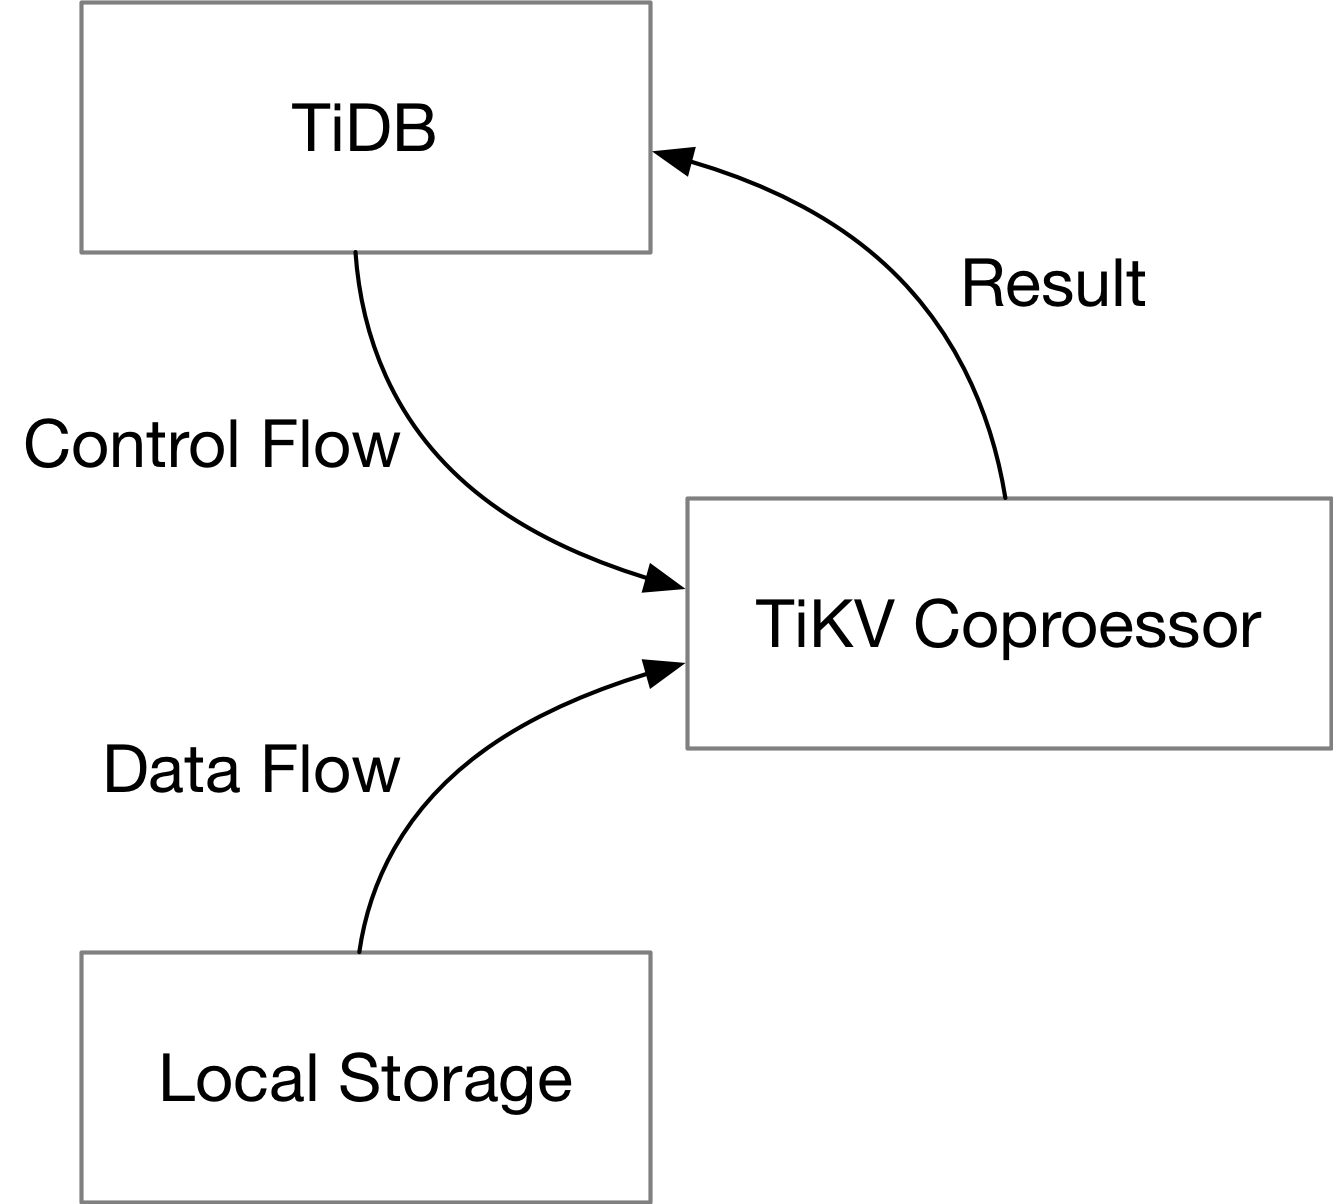
For a single query, TiDB will send the plan down to TiKV (the control flow), and TiKV will scan rows of table from the local storage engine (the data flow). TiKV Coprocessor executes the plan with data from the local storage engine, and sends the result back to TiDB.
The plan and the data exist in different forms throughout the query execution process. In the following parts, we will focus on how they exist on TiKV in each stage.
The Plan
When TiDB needs to run a query on TiKV Coprocessor, it will encode the plan in the form of protobuf messages. The schema of the query plan itself is defined in tipb repository. Inside tipb, we have all SQL expressions supported by TiKV (and TiDB), each with a unique ID, and we define components used by a query, like executors and aggregators.
The plan is then sent to the gRPC service on the TiKV side, which requires another protobuf schema definition. The definition for that is in the kvproto repository. The plan is encoded in the data field of the request. Each Coprocessor request will specify the key range (or region) to operate on.
message Request {
    kvrpcpb.Context context = 1;
    int64 tp = 2;
    bytes data = 3;
    uint64 start_ts = 7;
    repeated KeyRange ranges = 4;
    // ...
}
As a developer, you may want to see what plan is pushed down to TiKV when running a query. This could be easily done with an SQL explain statement.
MySQL [test]> explain select count(*) from test where x > 10;
+-----------------------------+---------+-----------+---------------+-------------------------------------------------+
| id                          | estRows | task      | access object | operator info                                   |
+-----------------------------+---------+-----------+---------------+-------------------------------------------------+
| StreamAgg_17                | 1.00    | root      |               | funcs:count(Column#4)->Column#2                 |
| └─TableReader_18            | 1.00    | root      |               | data:StreamAgg_9                                |
|   └─StreamAgg_9             | 1.00    | cop[tikv] |               | funcs:count(1)->Column#4                        |
|     └─TableRangeScan_16     | 3333.33 | cop[tikv] | table:test    | range:(10,+inf], keep order:false, stats:pseudo |
+-----------------------------+---------+-----------+---------------+-------------------------------------------------+
4 rows in set (0.002 sec)
A push-down plan is marked as cop[tikv] in the task column.
The Data
On-Disk Format
TiKV stores its data by rows in its local KV storage engine (as of now, RocksDB or TitanDB). Upon the local KV storage engine, there is a MVCC transactional layer, called TxnKV, which Coprocessor reads data from. The key in TxnKV is composed of the table information and the primary key of a row. And other columns of this row is stored as the value in storage engine. For example,
t10_r1 --> ["TiDB", "SQL Layer", 10]
t10_r2 --> ["TiKV", "KV Engine", 20]
t10_r3 --> ["PD", "Manager", 30]
The TiDB row format (v2) is described in the A new storage row format for efficient decoding RFC.
In-memory Format
The executors (will be introduced later) will scan the data from TxnKV in small batches, and store them in memory. Contrary to the on-disk format, data are stored in a columnar way in memory. The memory format is called "Chunk format" in TiDB, and is in some way very similar to the Apache Arrow format. The implementation details are described in the Using chunk format in coprocessor framework RFC, and this slide. The format is implemented in components/tidb_query_datatype beginning with chunked_vec_.
Inside Coprocessor
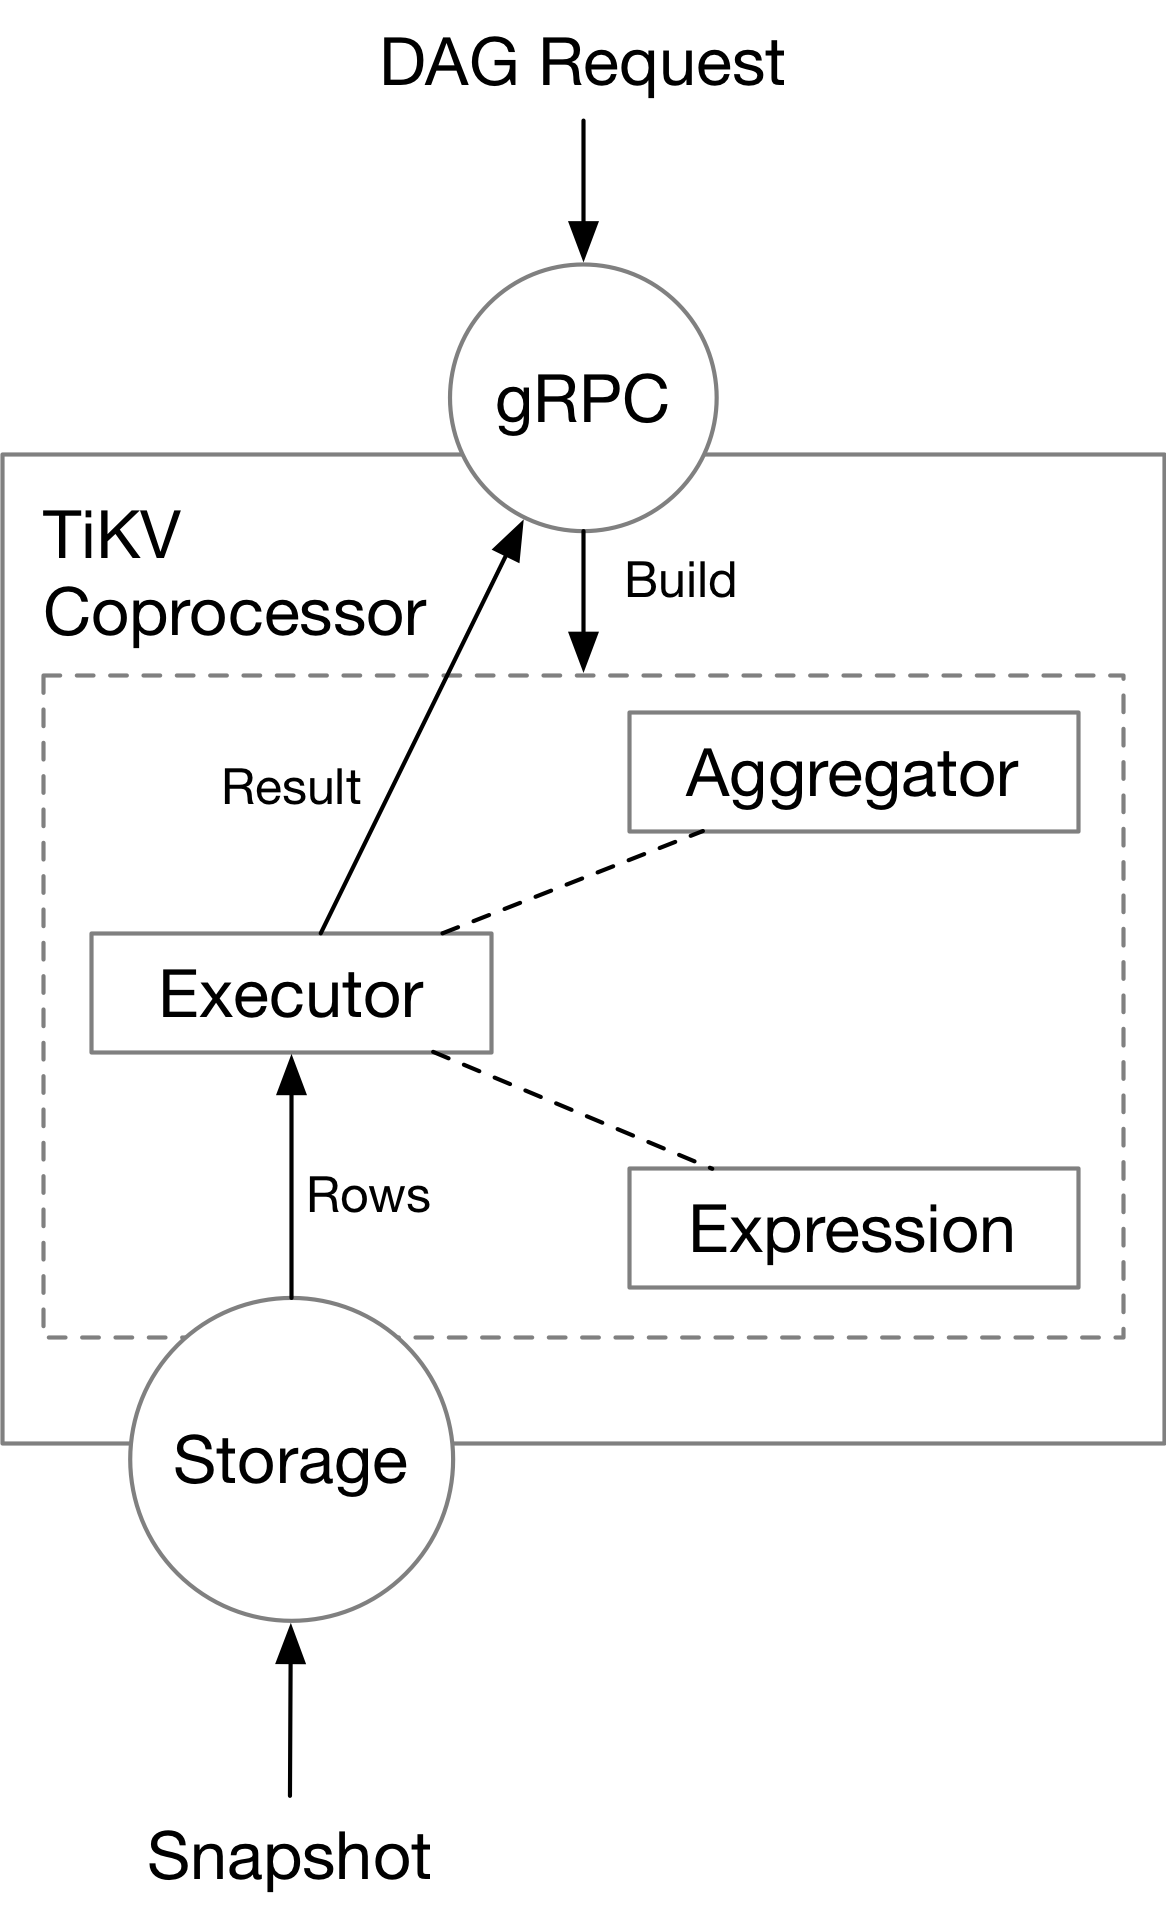
The TiKV Coprocessor contains necessary components to handle a cop read request, which include the expression framework, the aggregators, and the executors. We will cover these parts in the following chapters.